Longitudinal Wave Displacement#
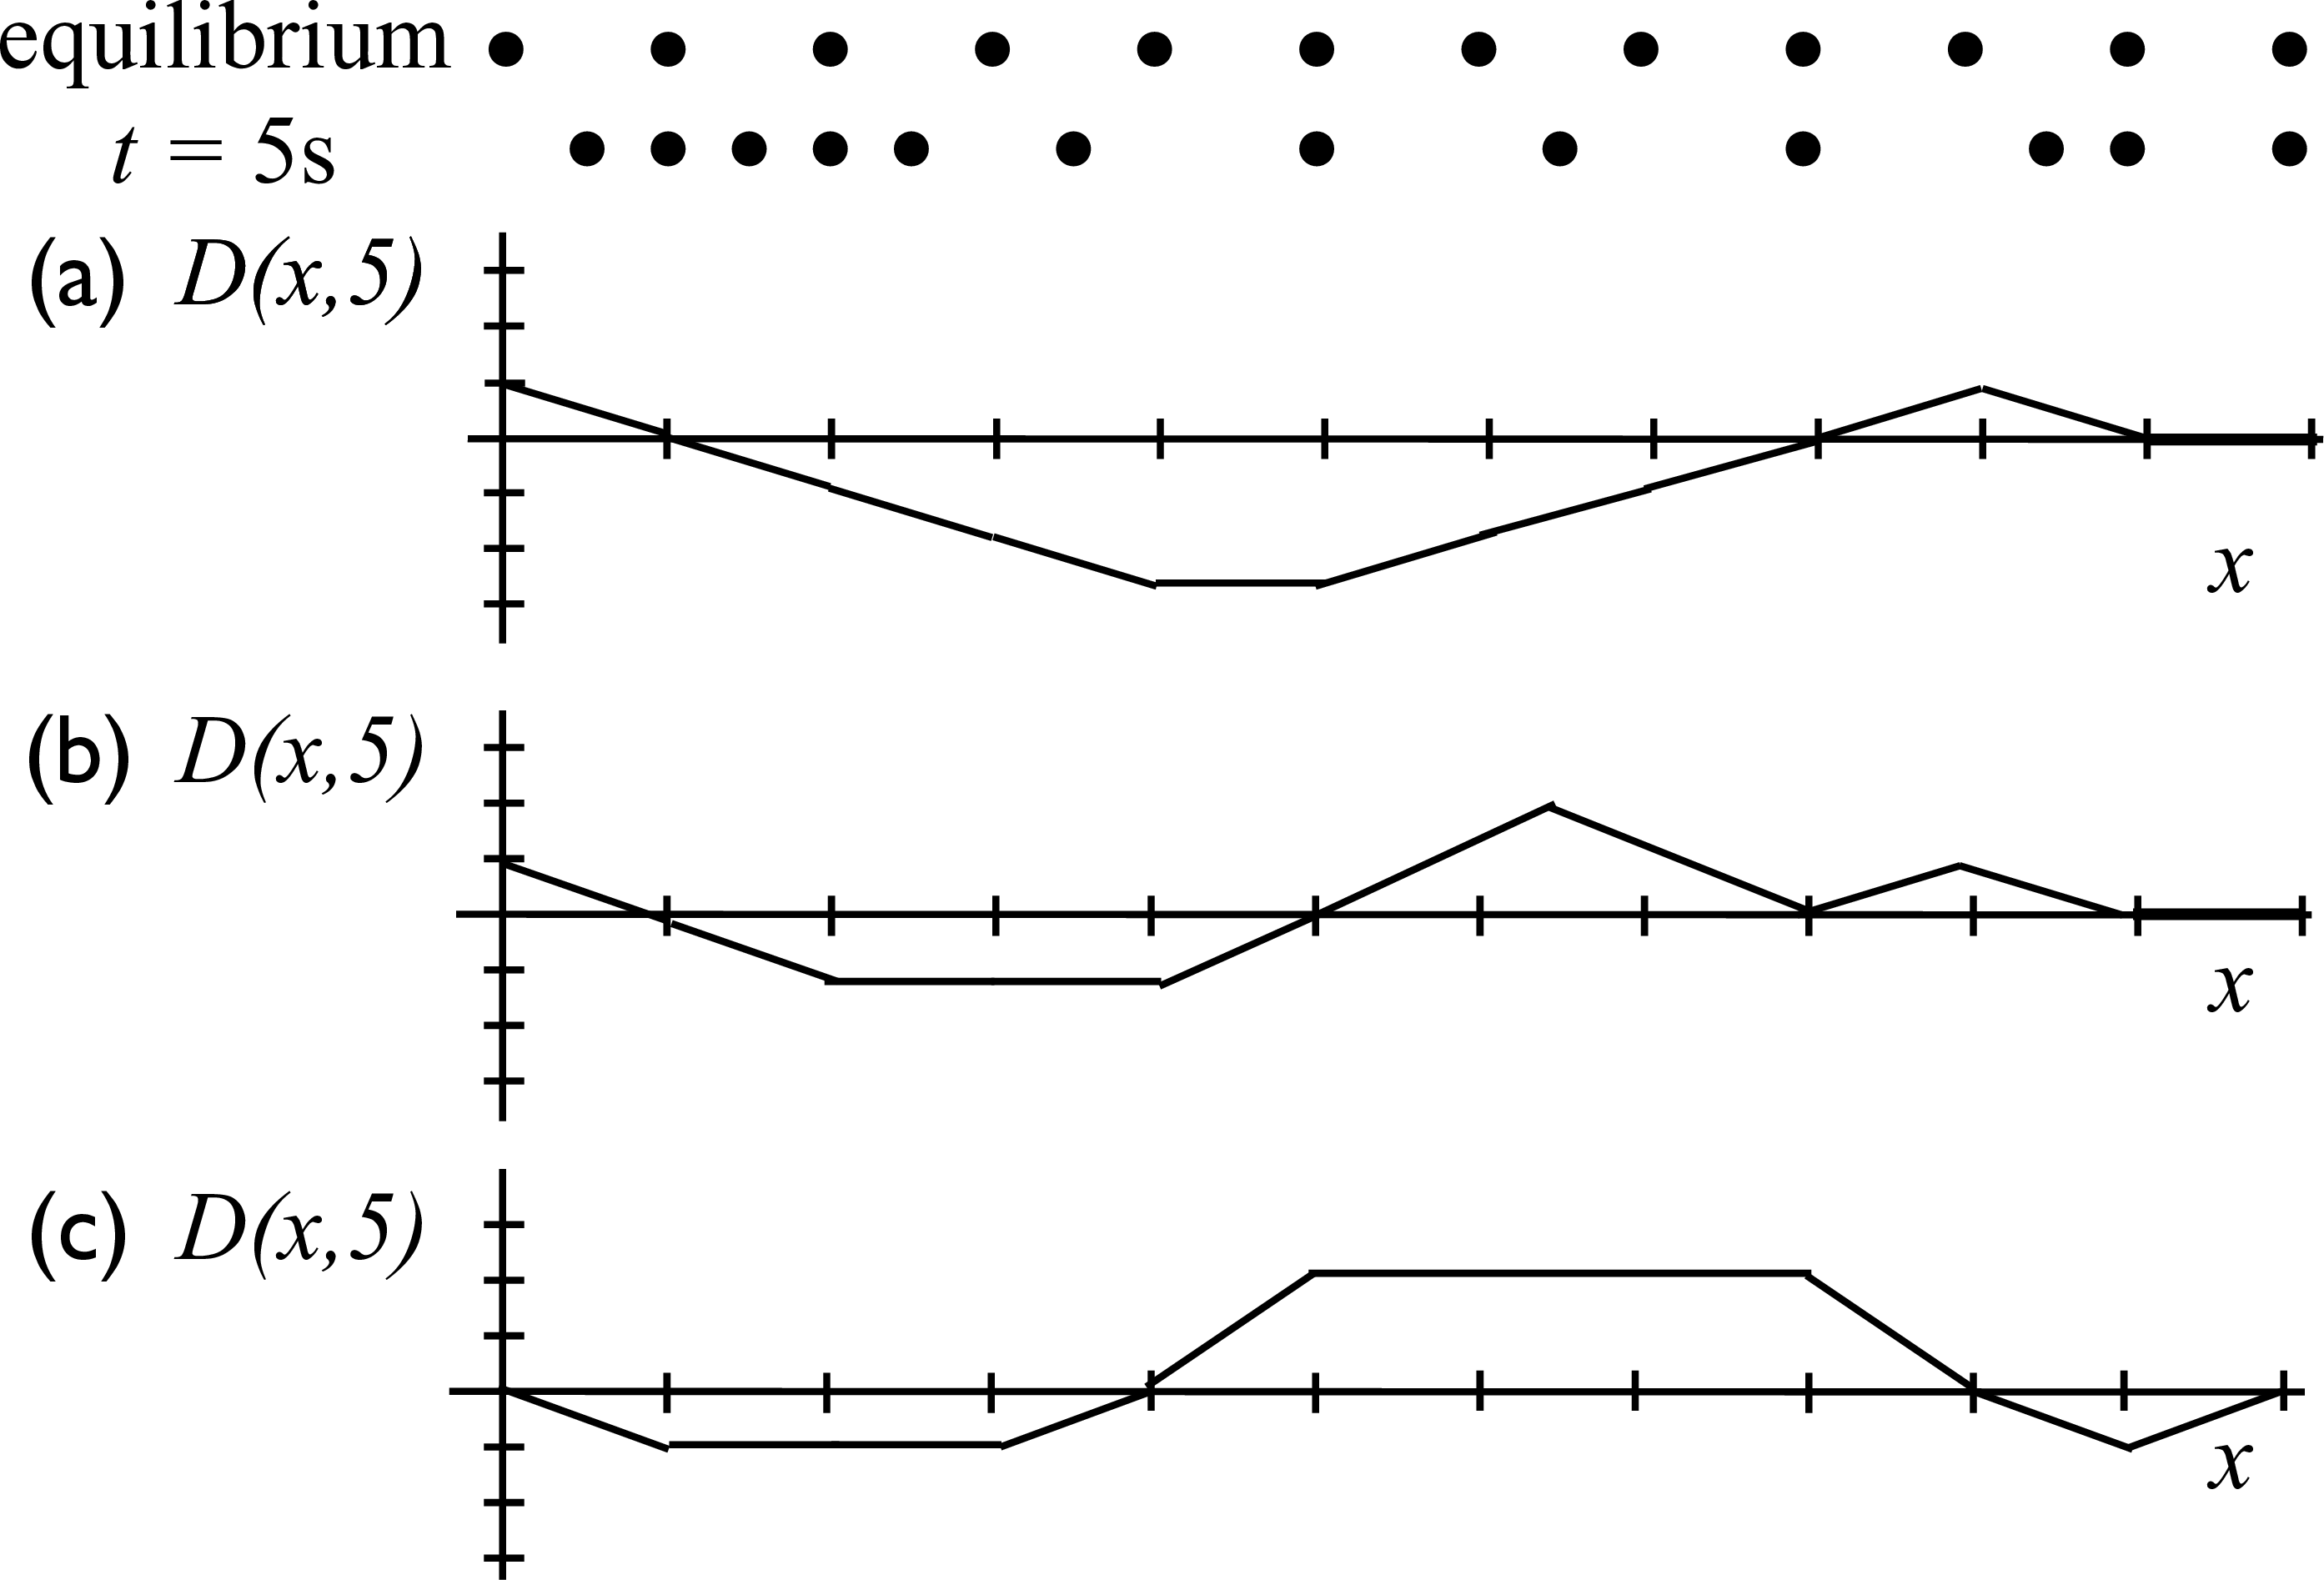
The top two dot figures show a longitudinal wave at equilibrium, and again at \(t = 5\) s after a displacement.


Part 1#
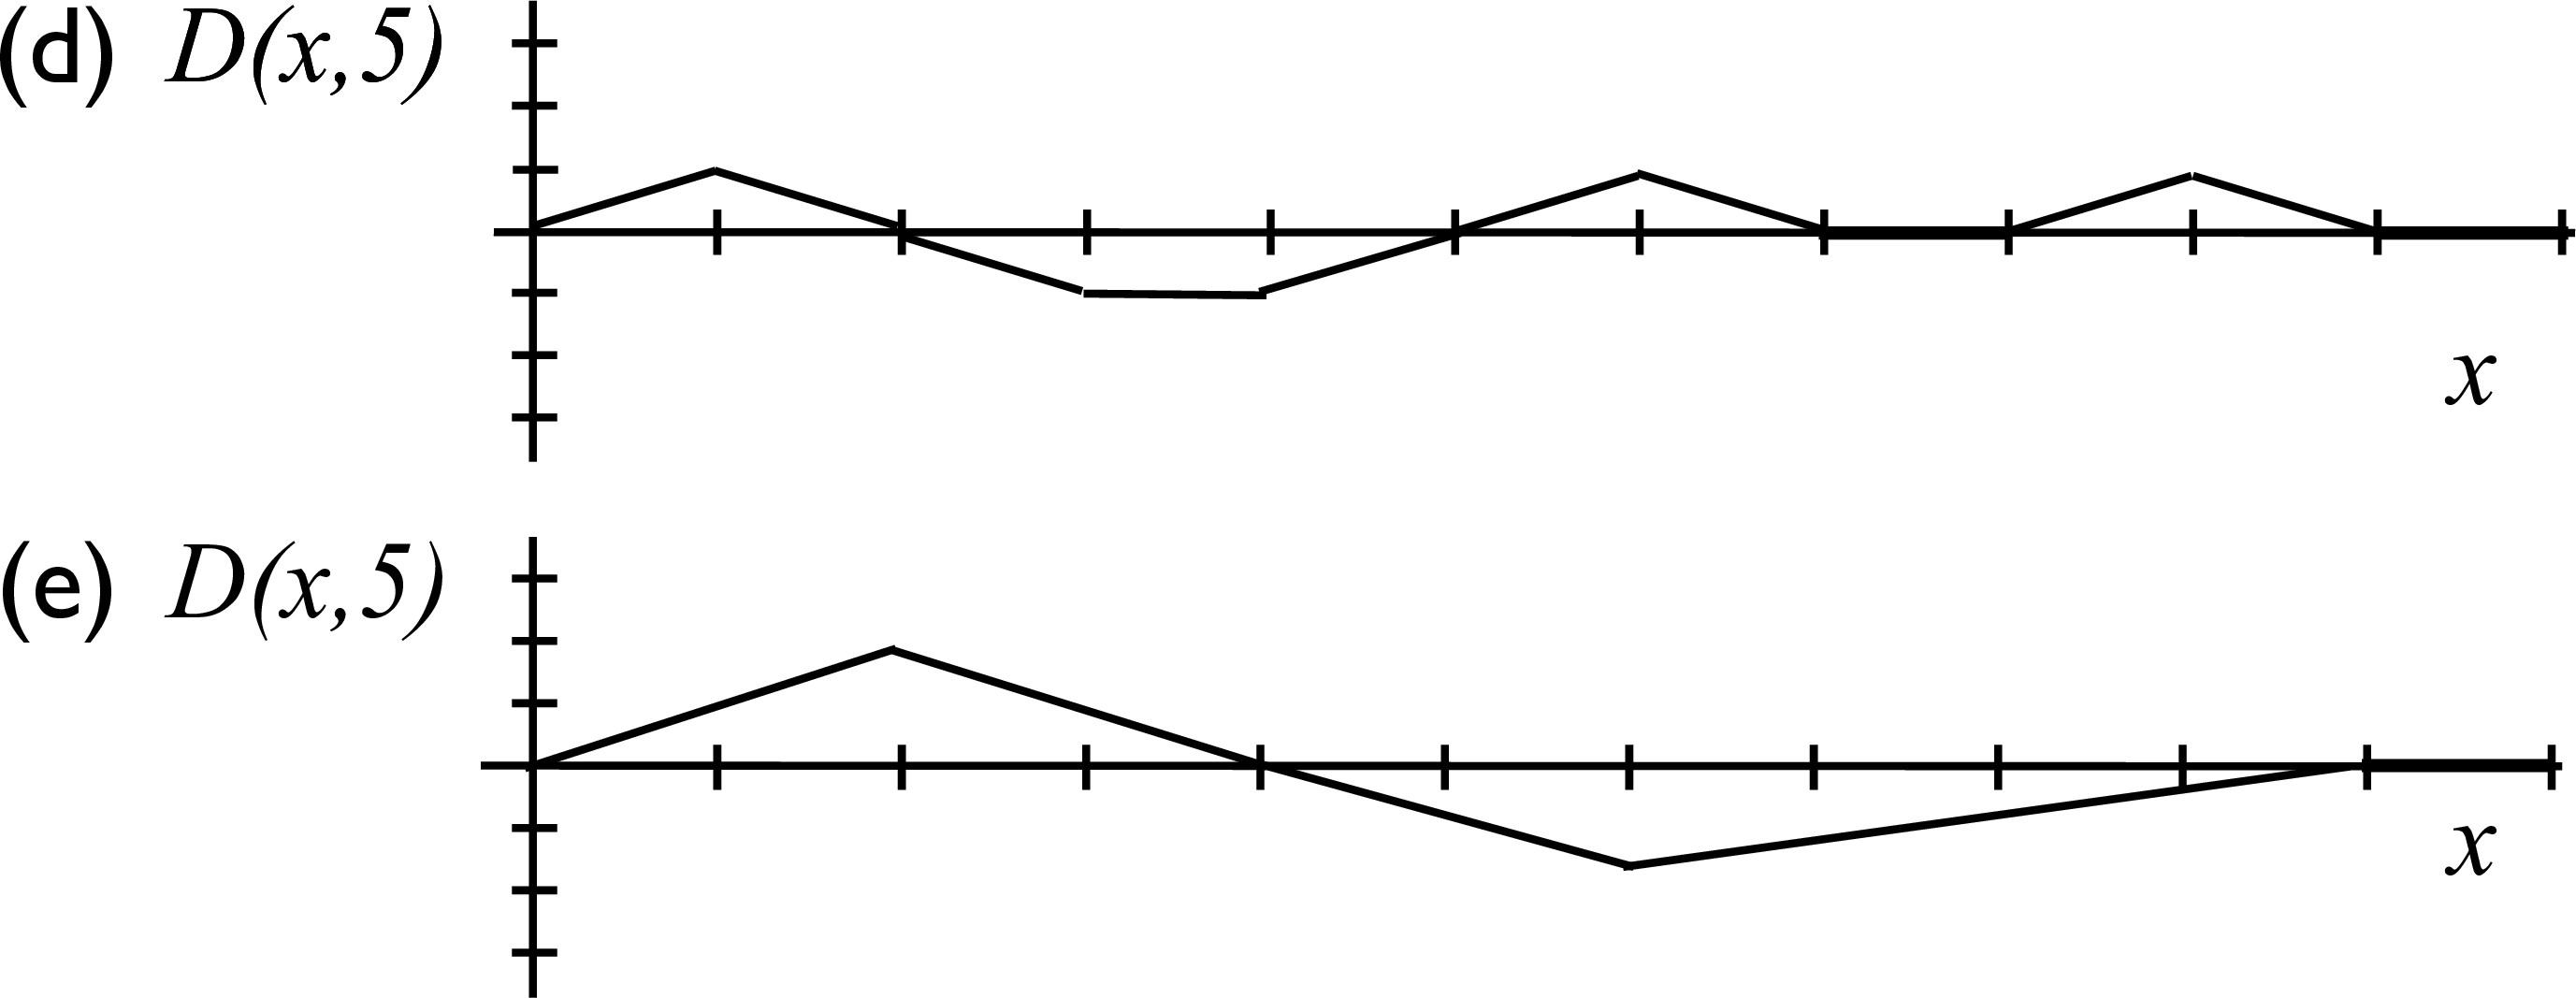
Which of the snapshot graph in the figure of the displacement as a function of position at \(t = 5\) s could represent this longitudinal wave?
Answer Section#
A
B
C
D
E
Attribution#
Problem is licensed under the CC-BY-NC-SA 4.0 license.

